
|
|
| NEC Charts Compiled Over Years of Research | |
|
|
|
|
By James Boone, Electrical Designer. The need for these charts is obvious in that they compile a lot of information in one easy to find document. For years I have struggled to search many books and pages of information till I came up with the opportunity and method to record my findings in an organized concise manner. Once I found a method that worked for one I began a trek to make pages of everything I learned over time. All of the things recorded in these charts are accumulated knowledge and research in many areas of personal interests and business. I hope you find the information helpful as I have.
These pages are constantly changing and evolving over time as more facts come in and ideas expand. Please sign up on our web page to keep the latest updates of these and other new documents. Perhaps someone can suggest some new ideas that may one day be included but we have a few more ideas of our own.
Click on each chart title to download the PDF.
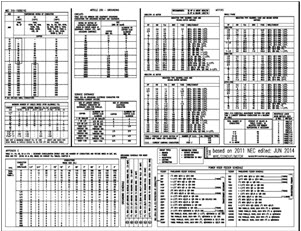
This chart is designed to allow designers or field technicians the ease of finding NEC charts without the need of a code book. Readers should make their own determinations that the information contained herein is relevant to any specific situation where wiring is concerned. This chart incorporates most all instances of sizing wire ampacity, conduit fill, motor charts, grounding, power riser schedule and grounding schedule. The riser and grounding schedules show no particular code requirement, but a suggestion of naming wires for use in power risers, although there is no consideration for voltage drops. Make all adjustments as required. The motor charts were compiled from manufacturing agents for sizing motors that are within normal bounds of circuiting.
This chart has information regarding sections in the NEC, formulas, conduit table, power factor selections, some circuit design information, motor charts, working space and basic information for generators/elevators. This chart also includes a full service transformer information guide but depending on transformer specifics, can change, based on many design characteristics. Use this information only when using general specifics. This chart also shows general panelboard and transformer dimensions based on general information. Use sizes and information only as a general rule of thumb.
This chart has many tables that can be used for determining what type of service/branch to designate for a riser element. The elevator chart is only a suggestion as exact sizing is based on many factors that may not immediately be known on design startup. There are some useful notes to recall when designing electrical systems in buildings. There is also some less important tables:
GENERAL LIIGHTING INFORMATION CHART Over years of hearing terms like Kelvin (temperature) to describe light brightness, we decided to do a little research into why it is called that. Like any good researcher I dug deeper to find much more. Shown on this chart are tables with detailed information on many lighting characteristics.
9th EDITION IESNA AND 2010 ASHRAE 90.1 CHART There are two important lighting considerations when designing commercial buildings. Here are some of the most important tables used in that design process. ASHRAE:
IESNA:
Both:
When designing old buildings with existing floor space for renovations, sometimes there is a need to describe what breakers are existing in the building. Used in conjunction with existing riser diagrams of original buildings, this sheet gives users methods for recording those field conditions. There should be room on this sheet to record the breaker tag and size. Use ties to show multi-pole breakers. Circle pertinent information.
EXAMPLES OR ELECTRICAL PANELBOARD SCHEDULER OUTPUT This sheet shows examples of outputs the EPS program will output. These forms were created in less than 10 seconds, once all the circuit data was input into the program. All trimming, breaker handles and riser elements were done automatically. Loads, panel source and times are recorded on a none plotting layer (shown in gray) so users can see when the schedule was created and can easily be updated (for the AutoCAD example).
AUTOCAD LINE AND VIEWPORT INFORMATION CHART There can be many methods to plot inside AutoCAD but only one ways to setup viewports which are important to know. The two most typical sizes used in commercial engineered plans are 24" x 36" and 30" x 42". Any view within AutoCAD can have many types of scales or views. This chart helps set those up with knowing, or relearning, what they are. With our experience in plotting and setting up drawings, we have come up with line weights that we use for our drawing techniques, along with toning. Meant to be used for any version of AutoCAD.
This chart is specifically designed to graphically show rotation angle of the earth and moon and how the moon rotates the earth. There is also a math formula to show how far we can see on the horizon based on height. One graphic also show why the moon doesn't have a solar eclipse each month and explains the month cycles of the moon as seen from earth.
This chart shows many facts about our solar system planets. There is also a heat index and wind chill tables. We also explain gravity on the ISS and its rotation.
NEC TABLE 9, VOLTAGE DROP CHART This chart shows NEC Table 9 AC resistance and reactance table for three single conductors in a conduit. This chart also shows the voltage drop examples. Powersoft Engineering uses a modified version of the equation shown in example 2 which also includes parallel runs. The formula for resistance and reactance include such things as ambient temperature, numbers of turns in wire along the length of conduit and insulation thickness. This takes some typical example of runs and compiles it into one easier to calculate example.
If you have any questions or comments about these charts created and compiled by James Boone, you may contact him at: sales@powersofteng.com
|
|||
|
| Visit: Exam Preparation | Continuing Education | Code Products | Newsletters | and more | |||
|
|
|||
|